
Splunk Dashboard Studio
Splunk dashboard studio got you covered for your advanced views
We all have been to a point when we wanted something more than a simple pie chart or bar graph from our Splunk dashboard experience which led us to work with HTML, CSS, and js. However, the software development field is continuously changing at a very fast pace. The HTML, CSS, and js which were helpful in fulfilling our requirements in the past are now falling behind the modern frameworks.
Splunk introduced dashboard studio to support all your advanced dashboarding needs. Splunk dashboard studio equips you with tools to build a customized dashboard in Splunk with an opportunity to design your layout, colors, images, and more.

How to get Dashboard Studio in your Splunk environment?
The dashboard studio is now a built-in feature in
- Splunk enterprise version 8.2 or higher,
- Splunk Cloud Platform 8.1.2103 or higher
How to get started?
The example hub is the best way to start your journey in dashboard studio.
- Check the ‘visualizations’ to understand the SPL syntax and source definition in json for the most common visualizations in Splunk such as single value, table, pie chart etc.
- Refer the example in ‘Search and Data’ to understand the different type of searches we can configure in dashboard studio.
- To understand the inputs and drilldown, please see the ‘Interactivity’ section of the example hub.
- Under ‘Complete Dashboards’ link, you can see the prototype of different dashboard views that you can achieve using dashboard studio.
Understanding the layouts
There are 2 layout options available with dashboard studio:
- Absolute: It gives you full control of your layout.
- Grid: This option is suitable for a quick organization.
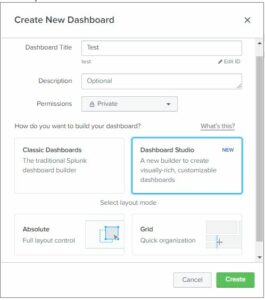
How to create a new dashboard?
- Go to dashboards tab in Search & Reporting application.
- Click on create new dashboard.
- Add the dashboard title, description (optional), Permissions. Select the dashboard studio and then the layout mode. Click Create.
What are the components available in the Dashboard Studio?
The following components can be leveraged to create your own customized view. A user has full control of the placement and looks of the components.
- Chart
- Inputs
- Icons
- Shape
- Image
- Text
Dashboard studio with its flexible layout enables both new and experienced users to easily create advanced visualizations.
Resources
Splunk docs on Dashboard Studio
Coming Soon
Dashboard studio in action